


Careers

What Are the Top Types of Dairy Free Alternatives?

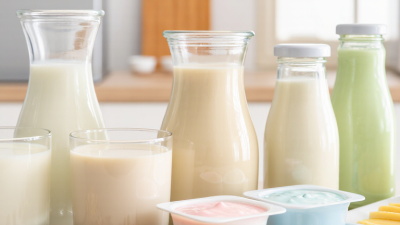
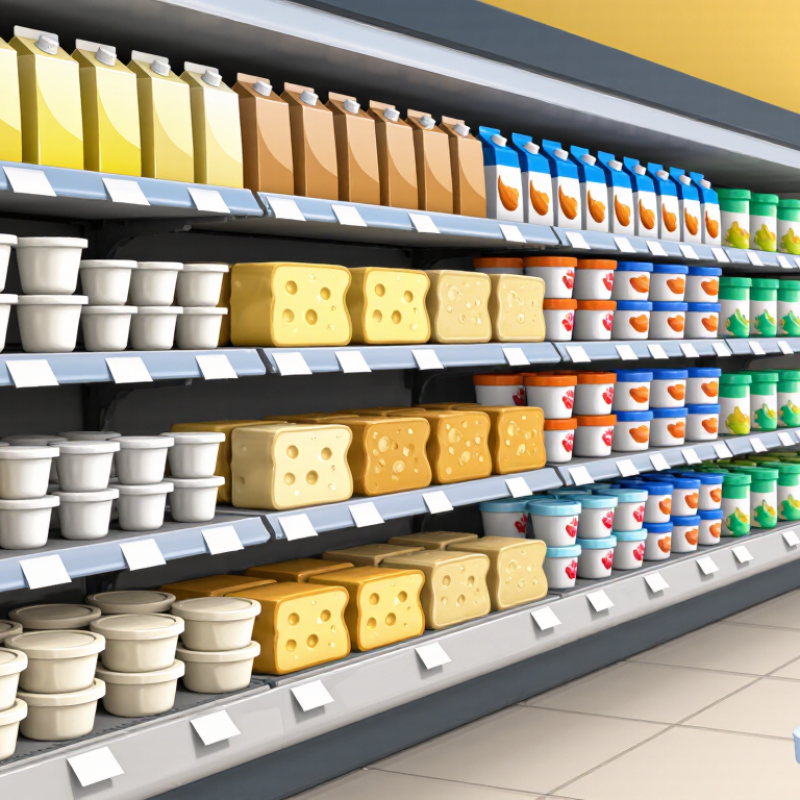
Dairy free alternatives now fill more than one shelf in many supermarkets. You may see oat milk beside almond milk, coconut yogurt near soy yogurt, and cashew cheese in the chilled case. The choice is broad. But these products do not all behave alike. A splash of oat milk may foam well in coffee, while another works better over cereal. Plant-based cheeses also vary in melt, saltiness, and texture.

Bruce Friedrich, president of the Good Food Institute and an alternative-protein industry expert, has described the direction of food innovation this way: “The future of meat is meat, the future of dairy is dairy, and the future of eggs is eggs—but better.” His remark points to a useful question: how closely can alternatives match the taste and role of familiar dairy foods? The answer depends on the product and the person eating it.

This guide looks at the top types of dairy free alternatives, including plant-based milk, yogurt, cheese, butter, cream, and frozen desserts. It considers common ingredients, everyday uses, and label details such as protein, calcium, and added sugar. Nutritional values can differ sharply between brands, even within the same category. Taste still matters. So does price. No single option suits every recipe or diet, and packaging claims deserve a careful look. That small detail is easy to miss. The aim is not to declare one product the winner, but to help readers choose with clearer expectations.
What Are the Top Types of Dairy Free Alternatives?

What Qualifies as a Dairy-Free Alternative?

A dairy-free alternative is a food made without milk or ingredients derived from milk. That includes familiar plant-based drinks made from oats, soy, almonds, peas, or coconut, as well as dairy-free yogurt and cheese. It does not include lactose-free cow’s milk: lactose is removed or broken down, but milk proteins remain. Whey, casein, butter, and milk powder are also dairy ingredients. That distinction matters.

The label deserves a careful read. In the United States, the FDA identifies milk as a major food allergen, and packaged foods containing it generally must declare milk on the label. People with milk allergies should also consider cross-contact warnings and seek guidance from a qualified health professional. “Plant-based” alone may not answer every ingredient question. Labels can be confusing. For context, the Good Food Institute’s 2023 U.S. retail sales report estimated that plant-based milk held about 15% of the milk category’s dollar sales. That market share shows these products are widely available, but it does not mean every option has the same nutrition. Calcium, protein, and added sugar vary, so compare the nutrition panel with your needs. I still find the wording imperfect: “alternative” describes a use, not a guaranteed nutritional match.

Plant-Based Milk: A $2.8B U.S. Category in GFI’s 2023 Data

Plant-based milk is a major part of the dairy-free market. The Good Food Institute’s 2023 data valued the U.S. category at $2.8 billion. That figure shows its scale, but it does not explain why each shopper chooses a particular option. Taste, price, availability, and dietary needs all matter. Some people want a creamy drink for coffee; others need an option that works in cereal or baking.

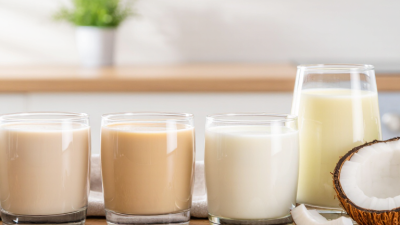
The category includes drinks made from oats, almonds, soy, coconuts, and other plants. Their flavors and textures differ. A chilled glass of oat drink may taste mild and smooth, while an unsweetened almond option can feel lighter. Soy-based choices often provide more protein, but nutrition varies by product. Check the label for protein, calcium, vitamin D, and added sugar, especially when replacing dairy regularly. Small details count.

Market size is not a nutrition score. The $2.8 billion figure measures the category’s economic footprint, not the quality of every carton or the needs of every household. Plant-based drinks can also behave differently in recipes, so a quick test in coffee or pancakes may save frustration. I still find the variety a little confusing. That’s worth admitting.

Dairy-Free Yogurt and Cheese: Cultures, Bases and Textures

Dairy-free yogurt depends on both its base and its cultures. Oat and coconut bases often produce a creamy, mild spoonful; soy can bring more protein and a firmer body. Fermentation with live cultures creates tang, but sweetness and thickness still vary by recipe. Texture matters. Grand View Research estimated the global vegan yogurt market at about $2.1 billion in 2023, and projected continued growth through 2030. That signals demand, not identical quality. A useful label check is the protein amount, added sugars, and whether live cultures are listed.

Dairy-free cheese faces a tougher texture test. Cashew bases can feel rich and soft, while starches and plant oils help sliced products hold their shape. Cultures add savory, fermented notes, though they cannot fully reproduce dairy’s melt or stretch in every recipe. Not every bite works. The Good Food Institute’s 2023 U.S. retail report put plant-based food sales at $8.1 billion, showing the category’s commercial reach, but not proving that every substitute matches its dairy counterpart. For cooking, test a small amount: a cheese that spreads well cold may turn oily in a hot pan. This category still feels unfinished, and that is worth noticing.

Butter, Cream and Frozen Desserts: Alternatives Beyond Milk

Butter alternatives behave differently in a hot pan. Many use vegetable oils, while some contain water or starches that affect browning. For flaky pastry, choose a firm block-style product; for sautéing, a spread may work, but check its smoke point. A 2023 report from the Good Food Institute and Plant Based Foods Association put U.S. plant-based food retail sales at $8.1 billion. That figure covers the full category, not butter alone, so it should not be read as proof that every alternative is equally popular. Texture matters.

For cream, oat, soy, and coconut-based options can add body to soups or sauces, but their flavors and protein levels differ. Coconut can taste sweet or pronounced; soy may bring more protein, though formulations vary. In frozen desserts, the base shapes the result: coconut often feels rich, while oat can produce a softer, less dense scoop. Read labels for saturated fat, added sugars, and allergens, especially when serving others. A practical test is to chill a small portion before buying more. It is easy to assume “dairy-free” means nutritionally similar to dairy; it does not. Check the package, and judge the product by the dish it needs to make.

How to Compare Nutrition, Fortification and Ingredients

Choosing a dairy-free drink starts with the job it needs to do. For cereal, coffee, or a smoothie, taste and texture matter; for a daily milk replacement, nutrition deserves a closer look. Soy and pea drinks often provide more protein than almond, oat, or coconut options, but recipes vary. Check grams per serving rather than relying on the front label. Small print matters.

Fortification can make a real difference. Look for calcium, vitamin D, and vitamin B12 if these nutrients are limited elsewhere in your diet. Compare amounts with the nutrition information for dairy milk, and check serving sizes. Some added calcium settles at the bottom, so shake the carton well. Easy to miss. Fortified does not automatically mean nutritionally identical.

Read the ingredient list, too. An unsweetened version can contain less added sugar than a flavored one, while gums or oils may affect texture. Their presence alone does not make a drink unhealthy. Consider allergies, personal tolerance, and how the product tastes in your usual meals. I would not judge a drink by one number; protein may be high while another nutrient is low. Labels also cannot tell you whether you will actually enjoy it. A practical comparison takes both the carton and your own routine into account.

What Are the Top Types of Dairy-Free Alternatives? How to compare nutrition, fortification, and ingredients
Beverage type Typical calories per cup Protein per cup Carbohydrates per cup Fat per cup Fortification to check Common ingredients Useful comparison notes
Soy beverage About 80–100 kcal, unsweetened About 7–9 g About 3–5 g About 4–5 g Calcium, vitamin D, and vitamin B12 are often added; amounts vary. Water, soybeans or soy protein, and sometimes oil, stabilizers, or added nutrients. Usually one of the higher-protein plant beverages. Check for soy allergy and compare added sugars.
Pea-protein beverage About 70–100 kcal, unsweetened About 7–8 g About 0–4 g About 4–5 g Calcium and vitamins D and B12 may be added; check the nutrition label. Water, pea protein, and sometimes oil, starch, flavoring, or stabilizers. Often provides protein comparable to soy, but formulations differ. Check sodium and ingredient sensitivities.
Oat beverage About 90–130 kcal, unsweetened About 2–4 g About 12–20 g About 3–5 g Calcium, vitamin D, and vitamin B12 are commonly added, but not universal. Water, oats, and sometimes oil, enzymes, salt, or stabilizers. Typically higher in carbohydrates than nut beverages. Check the added-sugar line and gluten cross-contact statement if relevant.
Almond beverage About 30–60 kcal, unsweetened About 1–2 g About 1–3 g About 2–4 g Calcium and vitamins D and E may be added; fortification varies by product. Water, almonds, and sometimes oil, stabilizers, salt, or added nutrients. Often low in calories when unsweetened, but also low in protein. Not suitable for people with tree-nut allergies.
Rice beverage About 100–130 kcal, unsweetened Usually less than 1 g About 20–25 g About 2–3 g Calcium and vitamins D and B12 may be added; check the label. Water, rice, and sometimes oil, salt, or stabilizers. Usually higher in carbohydrates and low in protein. Rice beverages are not nutritionally equivalent to cow’s milk.
Coconut beverage (carton) About 40–80 kcal, unsweetened Usually less than 1 g About 1–3 g About 4–5 g Calcium and vitamins D and B12 may be added; fortification is not guaranteed. Water, coconut cream or coconut extract, and sometimes stabilizers or added nutrients. Often low in protein. Carton beverages differ substantially from canned coconut milk, which is much richer and higher in calories.

Values are approximate ranges for one cup (about 240 mL) of unsweetened, ready-to-drink beverages and can vary considerably by recipe and serving size. Fortification is product-specific: compare calcium, vitamin D, vitamin B12, protein, and added sugars on the Nutrition Facts label. Shake fortified beverages before pouring, as added minerals may settle.