


Careers

Top 10 Plant Based Nutrition Suppliers Worldwide

Plant based nutrition has moved from specialist shelves into mainstream product development, yet suppliers differ greatly in ingredients, scale, and transparency. Michael Pollan, a food writer and professor who has examined food systems, offered a concise reminder: “Eat food. Not too much. Mostly plants.” The line is memorable, though it does not answer every sourcing question.

This guide introduces ten plant-based nutrition suppliers operating across global markets. It considers what buyers can verify: ingredient origins, available product formats, manufacturing capacity, quality documentation, and support for formulation. A pea protein powder, for example, may look similar across catalogs, but its taste, solubility, and batch consistency can affect a finished drink. Details matter.

Not every supplier serves every region or product category. Availability, specifications, and certifications can change, so buyers should confirm current information directly with each company. That caveat is important. A polished website is not proof of reliable supply, and “plant-based” alone does not establish nutritional value. This overview is a starting point, not an endorsement or a substitute for technical review. It aims to help readers compare suppliers with clearer questions about traceability, documentation, and practical fit. Some comparisons will remain imperfect; public information is uneven, and supplier claims do not always allow direct, like-for-like evaluation.
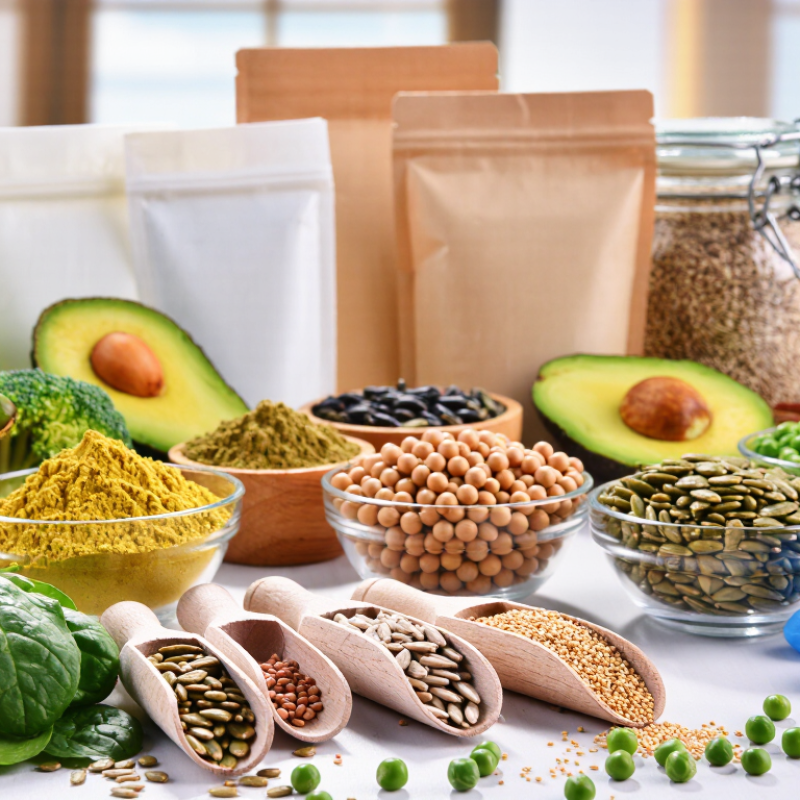
Top 10 Plant Based Nutrition Suppliers Worldwide

Defining Plant-Based Nutrition Suppliers: Ingredients, Products, and Global Scope

Before comparing the Top 10 list, readers need a clear definition of supplier. Plant-based nutrition suppliers can provide raw ingredients, formulated foods, or both. Their role may include sourcing, processing, blending, and technical support. Some sell protein isolates or oils; others supply ready-to-mix powders, drinks, and meal components. The boundary is not always neat.

Common inputs include peas, soy, oats, pulses, seeds, and fungal or algal materials. Suppliers may refine these into protein concentrates, fibers, starches, or micronutrient blends. Finished offerings can range from single-serve sachets to bulk ingredients for food manufacturers. Labels matter. A “plant-based” claim describes the source, not necessarily the full nutritional profile. Buyers should check protein quality, allergen controls, fortification levels, and batch documentation.

Global scope means more than shipping across borders. Supply chains vary in crop availability, processing capacity, and climate exposure. A reliable comparison looks at traceability, independent testing, and clear specifications, while recognizing that standards differ by market. Ask how seasonal changes affect consistency. This is easy to overlook. No supplier fits every use. A technically strong ingredient may still need adjustments for taste, texture, or processing conditions. That trade-off deserves honest attention.

Market Context: U.S. Plant-Based Food Sales Reached $8.1B in 2023 (GFI)

U.S. retail sales of plant-based foods reached $8.1 billion in 2023, according to the Good Food Institute (GFI). That figure offers useful context for suppliers worldwide: plant-based products already occupy a substantial place in a major food market. The number reflects retail sales, not supplier revenue or the size of every nutrition ingredient category. That distinction matters.

Behind the total are everyday choices: a carton of oat drink, a tofu meal, or a plant-based burger picked up during a grocery run. For suppliers, demand creates opportunities in protein ingredients, oils, fibers, and formulation support. Yet a large market does not guarantee easy growth. Taste, price, nutrition, and reliable sourcing all shape whether shoppers buy again. Small details matter.

GFI’s sales figure is a snapshot, not a promise of future performance. It also cannot show which products drove sales or how evenly demand was distributed across regions and categories. Suppliers assessing the market should pair headline figures with product-level research and clear nutrition data. There is room for improvement, too: plant-based products can vary widely in protein, sodium, and overall nutrient content. A compelling label is not enough.

U.S. Plant-Based Food Retail Sales Reached $8.1B in 2023

A market-context snapshot for the global plant-based nutrition supply sector.

The Good Food Institute reported $8.1 billion in U.S. plant-based food retail sales in 2023. This market-wide figure provides context and does not compare individual suppliers or brands.

Source: Good Food Institute (GFI), 2023 U.S. plant-based food retail sales.

The Top 10 Worldwide: Comparing Suppliers of Soy, Pea, Wheat, and Other Proteins

Top 10 Plant Based Nutrition Suppliers Worldwide

Comparing global suppliers of soy, pea, wheat, and other proteins means looking beyond headline protein percentages. Soy often offers a well-rounded amino acid profile and useful functionality, but allergen controls matter. Pea protein suits many formulations, though its earthy taste or chalky texture can be noticeable. Wheat protein can add elasticity to baked foods, but it is unsuitable for people avoiding gluten. Rice, fava, and blended proteins offer other options, each with different flavor, cost, and processing needs.

A practical supplier comparison should check consistent batch specifications, origin information, allergen management, and independent quality testing. Ask for recent certificates of analysis, including protein and moisture values, and confirm that samples match production-scale material. Sustainability claims also deserve scrutiny: farming methods, transport, and processing can change the picture. No scorecard is perfect. I would treat rankings as a starting point, not proof that one supplier fits every product.

Tips: Test samples in the finished recipe, not just in water. Check flavor after cooking or storage, and ask how the supplier handles specification changes. Small details matter. A protein that performs well in a shake may behave very differently in a bar or baked product.

Top 10 Plant Based Nutrition Suppliers Worldwide - The Top 10 Worldwide: Comparing Suppliers of Soy, Pea, Wheat, and Other Proteins
Supplier profile Main protein ingredient Typical protein content* Nutrition and functionality Allergen considerations Common applications Major production regions
Soy protein ingredient suppliers Soy concentrate and isolate Concentrate: typically 65–70%; isolate: typically 85–90% or higher, on a dry basis Complete protein containing all essential amino acids; useful water-binding and emulsifying properties. Soy is a major food allergen in many jurisdictions. Meat alternatives, beverages, nutrition powders, bars, and bakery foods North and South America, and East Asia
Pea protein ingredient suppliers Yellow pea concentrate and isolate Concentrate: commonly 50–70%; isolate: commonly 80–85%, on a dry basis Generally rich in lysine; sulfur-containing amino acids are relatively limited. Performs well in many savory formulations. Not one of the major regulated allergens in many regions, but pea allergy and cross-contact remain possible. Plant-based meat, dairy alternatives, protein drinks, and snacks North America, Europe, and parts of Asia
Wheat protein ingredient suppliers Vital wheat gluten and wheat protein Typically about 75–80% for vital wheat gluten, on a dry basis Strong viscoelastic properties create structure and chew; lysine is the first limiting essential amino acid. Contains wheat gluten; unsuitable for people with celiac disease and generally unsuitable for gluten-free diets. Seitan, meat analogues, noodles, and bakery products Europe, North America, Australia, and major wheat-growing regions of Asia
Rice protein ingredient suppliers Rice protein concentrate and isolate Common commercial grades are roughly 70–85%, depending on product and processing Often used in blends; lysine is relatively low compared with many legume proteins. Flavor and texture vary by grade. Rice is not a major regulated allergen in many jurisdictions; ingredient-specific checks are still necessary. Powders, bars, beverages, and complementary protein blends East and South Asia, Europe, and North America
Fava bean protein ingredient suppliers Fava bean concentrate and isolate Concentrates and isolates vary widely; isolates are commonly around 80% or higher Legume protein with useful water-binding and emulsifying properties; amino acid profile can complement cereal proteins. Not a major regulated allergen in many regions, though legume sensitivities and cross-contact should be considered. Meat alternatives, extruded foods, snacks, and protein blends Europe, North Africa, the Middle East, and other temperate regions
Chickpea protein ingredient suppliers Chickpea flour, concentrate, and isolate Flour is commonly about 20–25%; protein-rich concentrates and isolates can be substantially higher Offers protein alongside starch and fiber in less-refined formats; composition depends strongly on ingredient type. Legume allergy is possible; check product specifications and cross-contact controls. Pasta, baked snacks, ready meals, and plant-based foods South Asia, the Mediterranean region, Australia, and North America
Lupin protein ingredient suppliers Lupin flour and protein-rich fractions Flours are often around 35–45%; protein-rich fractions vary by process High-protein legume ingredient that can contribute fiber and improve texture in selected food formulations. Lupin is a recognized allergen in some jurisdictions and may cross-react with peanut allergy. Bakery products, pasta, snacks, and meat alternatives Europe, Australia, and other temperate agricultural regions
Potato protein ingredient suppliers Potato protein concentrate and isolate Protein-rich commercial fractions are commonly around 75–90%, depending on grade Can provide strong functional performance, including foaming and emulsifying properties; quality is process-dependent. Potato is not a major regulated allergen in many regions; verify processing aids and facility cross-contact. Specialty nutrition, bakery, snacks, and selected meat alternatives Europe and other regions with established potato-processing industries
Canola protein ingredient suppliers Canola or rapeseed protein fractions Varies substantially by fraction and process; commercial ingredient specifications should be checked individually Can offer a useful amino acid profile; flavor, solubility, and commercial availability depend on processing technology. Check local allergen rules and product documentation; cross-contact controls are supplier-specific. Protein blends, beverages, and emerging plant-based food applications Canada, Europe, and other regions that process rapeseed or canola
Mung bean protein ingredient suppliers Mung bean protein concentrate and isolate Protein-rich fractions vary by process; isolate grades are commonly specified at around 80% or higher Legume protein with potential use in blends; functionality and flavor vary with extraction and refinement. Legume allergy is possible; allergen status and cross-contact should be confirmed for each product. Noodles, snacks, protein blends, and specialty plant-based foods South and East Asia, with additional production and processing in other regions
*Protein figures are indicative ranges for common commercial ingredient forms, generally expressed on a dry basis. They are not specifications for individual suppliers or products; actual composition, processing, allergen status, and availability vary. Supplier profiles are anonymized ingredient categories, not a ranking of named companies.

Supplier Assessment: Production Capacity, Certifications, Nutrition, and Traceability

Top 10 Plant Based Nutrition Suppliers Worldwide

Supplier Assessment: Production Capacity, Certifications, Nutrition, and Traceability

A credible supplier assessment looks beyond a large factory and a polished certificate. OECD-FAO’s Agricultural Outlook 2024–2033 projects global oilseed production to grow about 1.2% annually, making verified capacity and sourcing plans important. Ask suppliers for monthly output, typical lead times, backup facilities, and recent delivery records. Nameplate capacity alone can mislead.

Check certification scope, issuing body, expiry date, and the exact production site covered. For nutrition, compare protein per 100 grams, amino-acid profile, sodium, allergens, and batch-specific test results. A certificate of analysis should match the shipment lot, not just a standard product sheet. Request farm or origin records, crop year, processor details, and batch codes; then test whether a mock recall can trace material quickly. These checks are practical, but they cannot guarantee every future shipment will be identical.

Tips: Request a recent audit summary and a sample traceability record. Verify both against the facility and product you plan to buy. A spreadsheet helps. It is not an audit. નોંધ

Sustainability Context: FAO’s Estimate of Livestock’s 14.5% Share of Human-Caused Emissions

FAO’s widely cited 14.5% estimate needs context. Its 2013 report, Tackling Climate Change Through Livestock, attributed about 7.1 billion tonnes of CO2-equivalent emissions annually to livestock supply chains. The estimate used 2005 data and included feed production, land-use change, processing, and transport. It is a historical global estimate, not a current measurement for every supplier. Scope matters.

For plant-based nutrition suppliers, that figure helps explain why buyers examine alternatives—but it does not prove every plant ingredient has a low footprint. A 2018 Science study by Poore and Nemecek assessed 38,700 farms across 119 countries. It found substantial variation between producers and products. Pea or soy protein may have different impacts depending on farming methods, processing energy, and transport. A dry ingredient in a small sack tells only part of the story.

Tips: Ask suppliers for lifecycle data, including its year, geographic coverage, and system boundaries. Compare products that provide similar protein and nutrition per serving, not just emissions per kilogram of raw ingredient. Check water use, land-use practices, and packaging too. Ask for evidence. Some data will be incomplete; record the gaps rather than treating estimates as certainty.